Physics
Ultrasound waves are sound waves. They have an Amplitude, which represents the strength (peak pressure) and a Period, which represents the length of time to complete 1 cycle (Figure 1). The distance of a complete cycle is called the Wavelength (Figure 2).
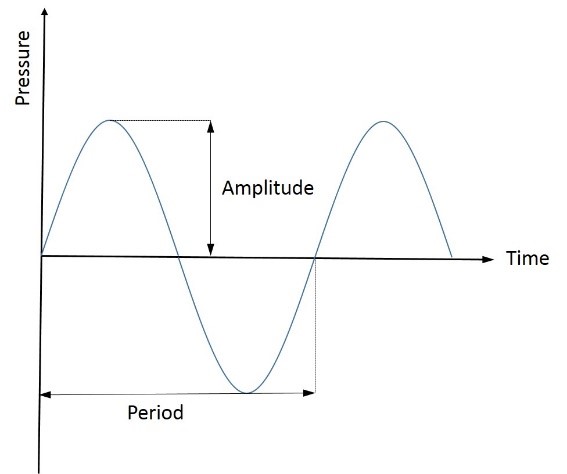
Figure 1: Amplitude and period
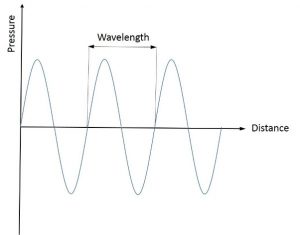
Figure 2: Wavelength
The frequency of a wave is the number of cycles per second:
Frequency = n cycles / time
1 Hertz (Hz) = 1 cycle per second
Ultrasound is sound of any frequency above the standard human pitch (>20kHz). Diagnostic ultrasound uses frequencies from 1 MHz to 20 MHz (Figure 3).
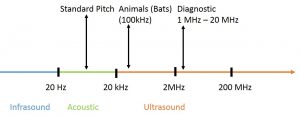
Figure 3: Standard pitch and ultrasound frequency range
Sound waves propagate through tissue with a Velocity (V), which is equal to wavelength (λ) times frequency (f):
V = λ x f
The velocity is constant in a given medium and will be determined by the density and stiffness of the medium (Figure 4). The ultrasound device assumes a velocity of 1540 m/s for its calculations (an average speed of sound waves through organic matter).
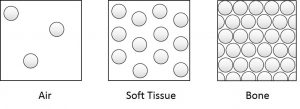
Figure 4: graphical representation of relative organ densities
The velocity of ultrasound is very similar in fluids and solid organs. However the velocity is much lower in air and much higher in bone (table 1).
| Tissue | Air | Water | Muscle | Fat | Liver | Spleen | Kidney | Bone |
| V (m/s) | 331 | 1496 | 1568 | 1476 | 1570 | 1565 | 1560 | 3360 |
Table 1: Ultrasound velocities through different tissues
Given the constant velocity of ultrasound in tissue, a higher frequency will decrease the wavelength, which will result in a better resolution. However, the higher the frequency the larger the attenuation (loss of strength) of the ultrasound wave, which will result in a lower maximal depth:
↑Frequency -> ↓ Wavelength -> ↑ Resolution
↑Frequency -> ↑ Attenuation -> ↓ Depth of Field
Figure 5 shows the ultrasound absorption (attenuation) rising in all media with rising frequencies. Please note that while bone will absorb most of the ultrasound power even at low frequencies, fluid filled structures will absorb almost nothing and so are ideal for use as ultrasound windows to visualise deeper areas. It is for this reason that fluid (e.g. blood) filled strictures like the liver and spleen are useful windows for visualising the kidneys.
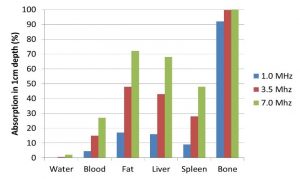
Figure 5: Ultrasound Absorption in 1 cm depth for different tissues and frequencies
The origin of the ultrasound image
Ultrasound machines use the piezoelectric principle to transform electrical energy into ultrasound waves. It then receives ultrasound waves and transforms it back into electrical energy.
These piezoelectric crystals and with that the ultrasound probes are the most expensive parts of the machines and should be treated with caution and respect (around £7000 per probe).
The ultrasound device sends an ultrasound signal out and measures the time and strength of the returning signals. The ultrasound device assumes that the velocity of ultrasound in human tissue is constant (1540m/s). It uses the time until the signal returns to calculate the depth of the structure (Figure 7). The higher the intensity of the returning echo, the brighter the speckle will be on B-mode (for Brightness, also called 2d on some devices).
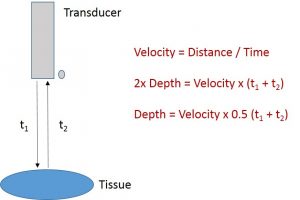
Figure 7: Depth and time
The intensity of the returned echo is dependent on the size of the impedance difference on an interface between two tissues (figure 8).
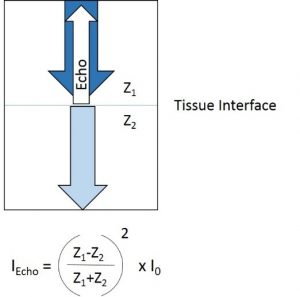
Figure 8: Impedance difference and echo intensity
Homogenous substances (e.g. fluids) will not produce any echos. In Figure 9 the ultrasound picture of a Vinaigrette solution is shown. On the left hand side the Vinaigrette is not mixed, resulting in only one interface between oil and vinegar, and thus a single bright line. On the right hand side – when the mixture has been shaken and the fluids are mixed – there are millions of small interfaces, resulting in a picture with millions of interfaces (Figure 9).
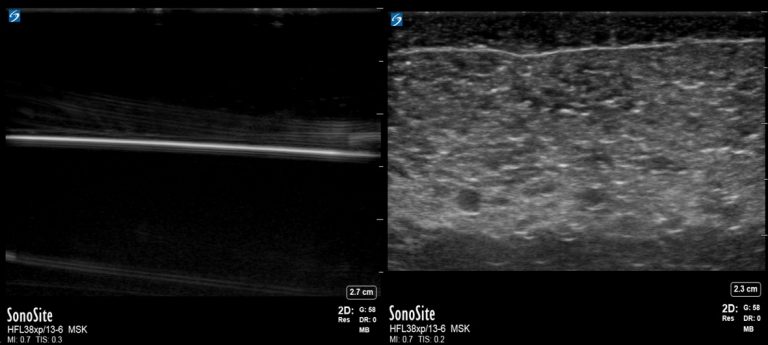
Figure 9: Ultrasound of Vinaigrette: unmixed (left) and mixed (right)
Similar to optical laws, ultrasound waves can be reflected, refracted, dispersed, absorbed and diverged. The most important attenuation processes are reflection and absorption (Figure 10).
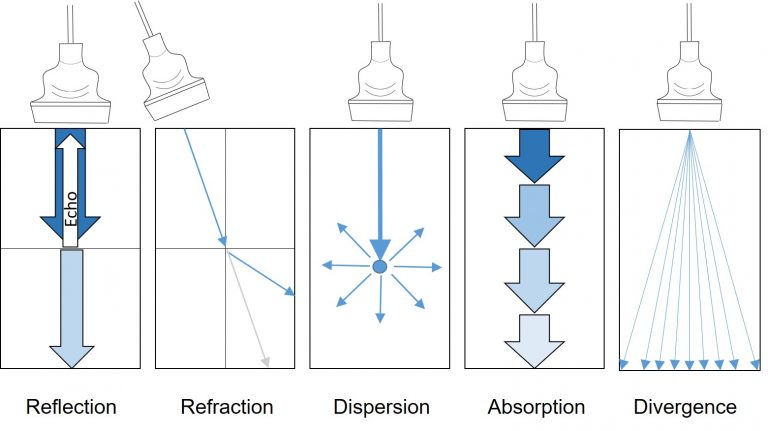
Figure 10: Attenuation of Ultrasound waves
Ultrasound modes
A – Mode
A, for Amplitude. In the early years of ultrasound before easy access to CT scanners ultrasound was used to monitor midline shifts. Amplitudes over time were used to show structural shifts (Figure 11). However, A-mode is still in use in Eye ultrasound.
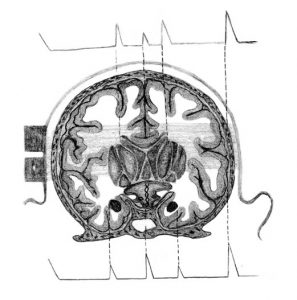
Figure 11: A – mode to monitor midline shift
B – mode
Also called 2d mode. Ultrasound signals are send out over whole Ultrasound probe and returning signals are plotted against time delays. The result is a 2d picture showing impedance differences at the right depths (Figure 12).
Figure 12: B – mode showing 2d picture
M – mode
M, for Motion. Showing the change over time on one line of ultrasound waves. This enables the device to show an area of interest with high resolution moving over time. Uses include cardiac muscle movement and IVC measurements (Figure 13).
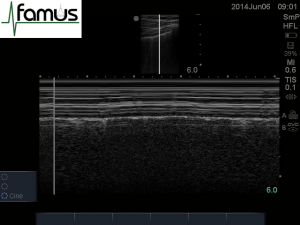
Figure 13: M – Mode, showing the change over time from a across a single line of Ultrasound
Doppler
The Doppler effect describes a change in frequency of sound waves depending on the direction in which they’re travelling (and being recorded). In Figure 14 the pitch (and with that the frequency) changes depending on the relative movement of the ambulance regarding a watching person. If the ambulance travels towards a person the sound is relatively high, gets lower once the ambulance is passing and even lower once the ambulance is moving away.
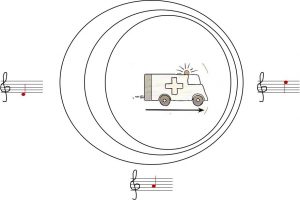
Figure 14: Doppler Effect – change of frequency depending on direction of sound waves
It’s worth noting that the ultrasound probe angle for optimal Doppler measurements should be different from 90 degrees, otherwise no flow can be observed (particularly in veins, where velocities are low).
Ultrasound transducers
For general ultrasound use the most frequently used probes are curvilinear, linear and phased array transducers (see figure 15 below). Other more specialised probes are cavity (gynaecology), hockey stick and TOE (both cardiology) transducers.
The linear probe is a high frequency transducer (>7 MHz, small wavelength), which has excellent resolution superficially, however secondary to the high frequencies the absorption of ultrasound is high and so the ultrasound depth is small (usually less than 9 cm). It is used for the visualisation of superficial structures (i.e. nerves, muscles, arteries, veins, thyroid, breast and testes) and needle guidance for biopsies, nerve blocks and vascular access.
The curvilinear probe is a low frequency transducer with a relatively good superficial resolution and a great depth (up to 30 cm). It is used for thoracic and abdominal ultrasound and can be used for the same purposes of the linear probe if greater depth is required. It has a relatively large footprint.
The phased array probe is a low frequency probe with a small footprint. Superficial resolution is extremely poor. It is ideal for echocardiography with great depth (up to 30 cm), and the right pulse repetition to assess muscle and valvular movement.
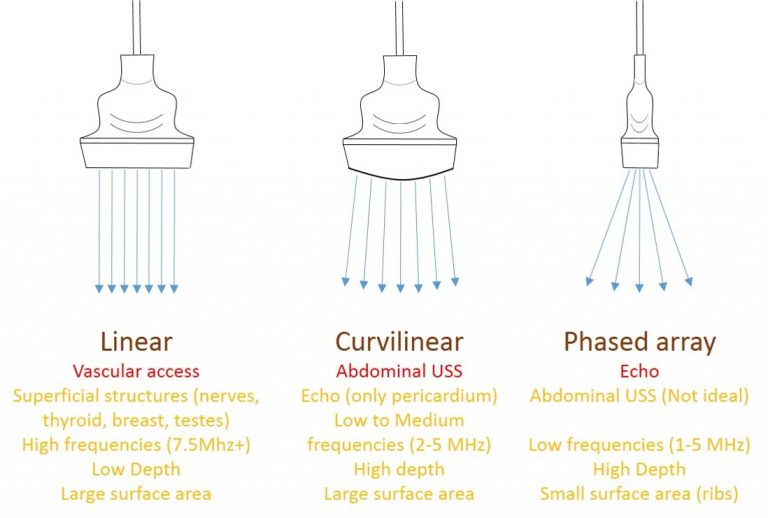
Figure 15: Ultrasound transducers
Ultrasound terminology
Echogenic: ability to produce echoes
Isoechoic: similar echogenicity to a neighbouring structure
Anechoic: no echoes, appears black on Ultrasound (fluids, Figure 16)
Hyperechoic: highly reflective, bright when compared with neighbouring structures
Hypoechoic: less reflective, less bright when compared with neighbouring structures
Figure 16: The urine in the bladder is anechoic, the balloon of the catheter is hyperechoic compared to surrounding tissues
Figure 17: Liver and kidney tissues are isoechoic, the surrounding ascites is anechoic
Artefacts
Ultrasound images might show structures which are not there, or changes which are not anatomical. These phenomena are called artefacts. Some artefacts are avoidable while others are used as diagnostic criteria. The following list introduces some general artefacts. The more organ specific artefacts will be presented in the organ specific chapters.
Dorsal acoustic shadow
If there is a large difference of impedance between tissues – as in soft tissue to bone – almost all of the ultrasound energy will be reflected, resulting in a very bright echo. Additionally in the case of bone or calcium (stones) the little non reflected ultrasound will be absorbed, leaving an echofree (shadow) area behind the reflection. This is seen commonly in thoracic ultrasound below the ribs (figure 18)
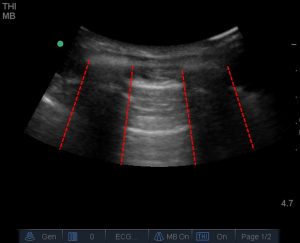
Figure 18: Dorsal acoustic shadow cause by ribs in thoracic ultrasound (commonly called the ‘rib shadow’)
Posterior Enhancement
The word enhancement is not quite right. A fluid filled area will absorb less ultrasound then the surrounding areas, as the waves pass deeper into the structure. At the same time, the ultrasound machine will ‘gain’ deeper areas more than superficial areas to compensate for anticipated absorption. For this reason, the much less absorbed ultrasound signals behind a fluid filled space will appear brighter than the surrounding tissues where much energy has been absorbed. This is an important diagnostic criteria for cysts and other fluid filled structures (but is not the only one; see figure 19).
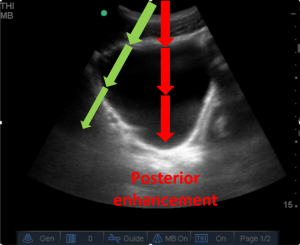
Figure 19: posterior enhancement below the fluid filled bladder. Compare the brightness of the tissue below the red arrows (which have passed through the bladder with minimal absorption) compared to below the green arrows, where much energy has been absorbed by the solid structures.
Lateral Wall sign
If ultrasound hits round structures tangentially, it will be deflected. No ultrasound waves will be just behind the lateral walls resulting in a narrow shadow behind the lateral wall. It is important not to confuse this with a dorsal acoustic shadow created by a high-impedence structure. Lateral wall signs should disappear with an altered angle of the ultrasound probe, whereas dorsal shadows would be expected to persist (figure 20).
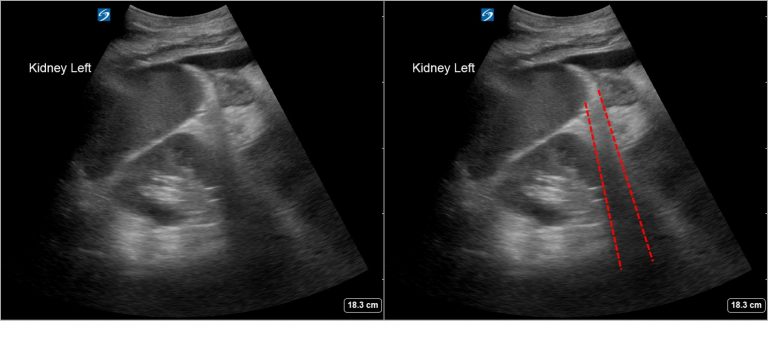
Figure 20: lateral wall sign, here generated by the spleen. On the left you can see the apparent shadow being cast by the lower spleen border, highlighted with dashed lines on the right
Mirror Artefact (Figure 21, video 1)
If ultrasound hits a strong reflector at around 45 degree angle (eg. the diaphragm), a second mirrored structure will appear on the screen on the other side of the reflector, caused by the longer travelling time for the reflected ultrasound wave (the ultrasound device does not know that reflection happened and so will show the structure at the measured depth according to the time taken for the ultrasound wave). The mirror artefact can be used for diagnostic reasons; mirrored liver above the diaphragm excludes a sizable pleural effusion on scanning the posterior part of the lung, and the obliteration of structures deep to it confirms it is artefact rather than hepatized lung. With hepatized lung, you would be able to view structures deep to it (such as great vessels, spinal column etc.).
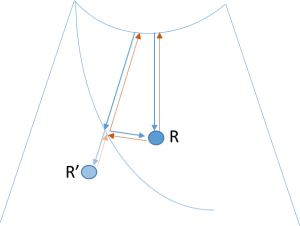
Figure 21: A structure R will be shown as R’ behind a strong reflector, caused by reflection of ultrasound at a strong reflector (eg the diaphragm)
Orientation
In Abdominal Ultrasound and Lung Ultrasound the marker dot should be on the left hand side of the screen. The corresponding marker on the Ultrasound transducer should aim towards the patient’s right hand side or the patient’s head.
For vascular access the marker should be always on the left hand side of the operator (particularly important if used from the head end to insert central lines!).
If the picture quality is suboptimal, there are some important manoeuvres to attempt. A left lateral position is useful for echocardiography (displacing lung between chest wall and heart) and abdominal ultrasound (displacing bowel).
Deep inspiration will move the liver inferiorly and will enable the liver to be used as a window to assess deeper structures.
The use of pressure (after warning your patient) can be also useful in displacing air from stomach or bowel.
Once an organ is found, the whole organ should be imaged. It is best to move to a position where the organ has just disappeared and then tilt through to image the whole organ. The next step is to change to a different axis and repeat the process. The following transducer movements are possible (figures 22-24).
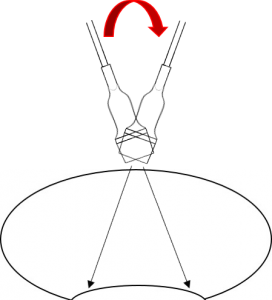
Figure 22: Tilting (short axis of curvilinear probe shown)
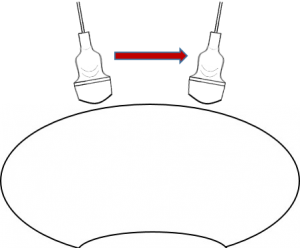
Figure 23: Sliding
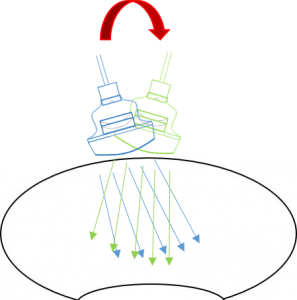
Figure 24: Rocking (long axis of curvilinear probe shown)
Have any questions?
If you have any FAMUS queries not covered by the following pages, please check out or FAQ section. If this still doesn't answer your queries, please contact FAMUS@acutemedicine.org.uk