Thoracic ultrasound has progressed from marking pleural procedures to an integral tool for the assessment of patients with respiratory failure. The protocol we endorse in FAMUS is the BLUE protocol, which was first published by Daniel Lichtenstein in Chest in 2008.
Choice of probe
For lung ultrasound two transducers are potentially needed. For assessment of the pleural line a high frequency linear transducer is preferable (e.g vascular probe). For obese patients the pleural line might only be seen with a curvilinear transducer due to the increased depth needed.
To assess pleural effusions, consolidation and for the presence of B-lines a curvilinear transducer (e.g abdominal probe) is the preferred option, however a phased array probe (e.g cardiac) might be used if no curvilinear transducer is available.
Anatomy review (brief!)
To understand lung ultrasound it is important to review some anatomy first. Rib shadows help with orientation. Ribs are high in calcium, so they will be seen as a very bright line on the anterior surface with a shadow cast below. If you move the transducer towards the cartilaginous part of the ribs you will then be able to look through the ribs and appreciate the pleura behind.
Lung sliding
In health, the visceral and parietal pleura are closely opposed, separated only by a minute layer of fluid which is not appreciable on ultrasound. This pleural line is seen as a bright white line just below the rib margin. During breathing (more specifically, ventilation) this fluid layer allows the pleura to slide across each other and this is appreciated on ultrasound as a shimmering appearance. This is usually described as lung sliding and is demonstrated in video 3. It is sometimes also referred to as ‘a marching of ants’.
ung sliding is an important concept to grasp. It’s presence means the parietal and visceral pleura are directly opposed and the lung is ventilating, and so rules out pleural effusion, pneumothorax and a host of conditions which dramatically reduce lung ventilation (eg very low tidal volume ventilation, ARDS, severe pneumonia, fibrosis). It’s often thought that a lack of lung sliding must mean pneumothorax, but as you will see this is not the case – it is one of the signs of pneumothorax but it is not diagnostic of it. See the BLUE protocol section for more detail on how to diagnose the different pathologies.
Seashore sign
It can be difficult sometimes to clearly determine if lung sliding is present. In the first instance, make sure you are using a high frequency probes (eg vascular) and minimise your depth, as this will give maximum definition of the pleural line; the next option is to use M-mode across the pleural line.
In a patient with lung sliding, the pattern generated will be like ‘waves on a beach’, where the waves represent the intercostal tissues, the pleural line the edge of the sea and the beach is the scattered artefact from the lung below (Figure 1 below).
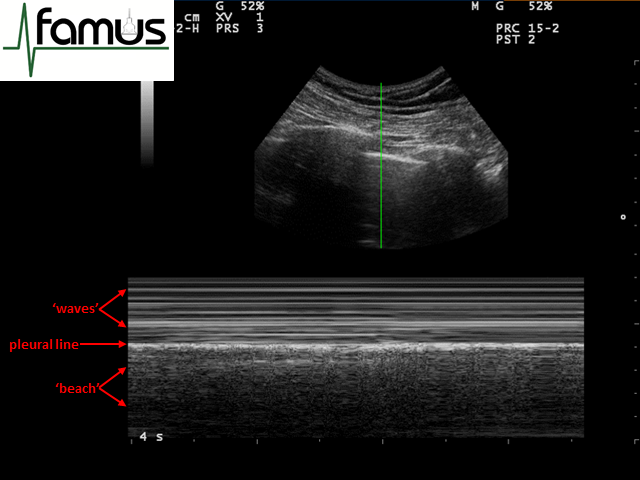
Figure 1: Waves on a beach appearance of normal lung when viewed through M mode – the ‘seashore’ sign
Another way of thinking about this is to imagine what happens when the ultrasound waves reach the pleural line. Normal lung has well aerated alveoli, which do not transmit sound very well (the impedance of air and lung tissue are very different), so the ultrasound waves are scattered all over once they pass through the visceral pleura which is moving with respiration (Figure 2). In an M-mode image this ‘scatter’ is represented by multiple individual pixels which together look like grains of sand.
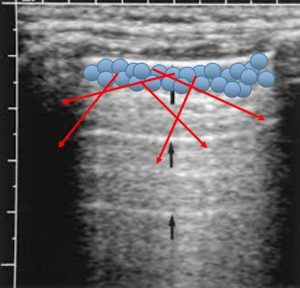
Figure 2: US waves (red arrows) scatter when they meet aerated lung. (Note A lines marked by black arrows; see below)
Stratosphere sign
The converse of this is the appearance of the M mode image when there is a pneumothorax present. In this instance, there is no scatter of the ultrasound waves by the moving visceral pleura as it does not oppose the parietal pleura. Instead, all you see below the pleural line is reverberation artefact from the pleural line and tissues above. This has the appearance of a stratosphere with horizontal lines the whole way down the image, with the brightest usually being the pleural line (Figure 3). This is also referred to as the barcode sign.
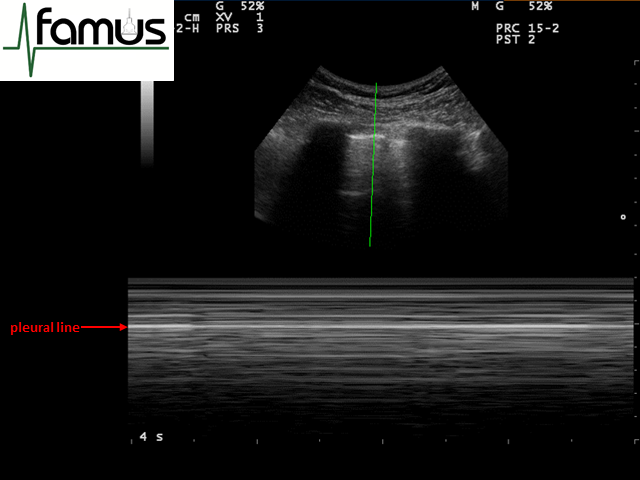
Figure 3: M mode appearances of a pneumothorax – the stratosphere sign
The image below shows both the seashore and stratosphere signs in the same image, as is created by placing the M mode cursor across the lung point. It helps to highlight the difference between these two signs, which often can seem subtle in real time (Figure 4).
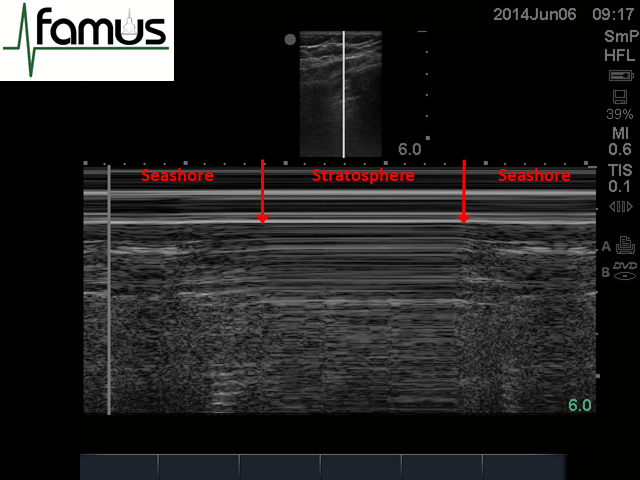
Figure 4: M mode through the lung point highlighting the seashore and stratosphere signs in the same image
Lung pulse
The third sign that may be elicited using M mode is called the lung pulse. This is created by the cardiac impulse being transmitted through the lungs to be picked up by the ultrasound probe, as occurs both in health and in many pathological conditions. It may therefore be seen in combination with both the ‘seashore’ and ‘stratosphere’ appearances. It is viewed on ultrasound as regular, subtle vertical lines (T lines) across an M mode trace (Figure 5).
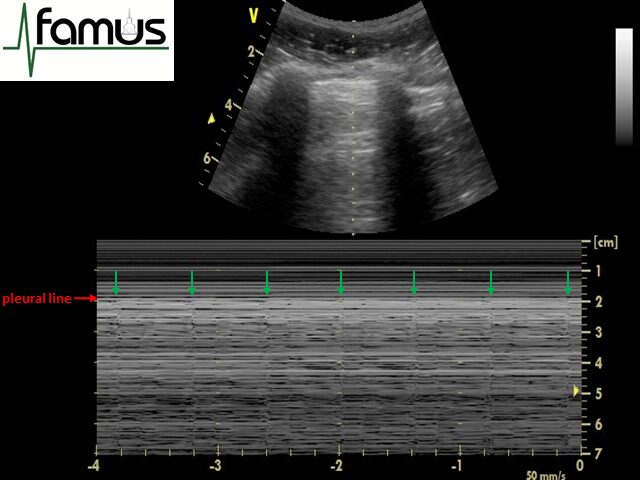
Figure 5: the lung pulse – regular vertical lines (here indicated by green arrows) seen across an M mode trace
It is important to understand that for the lung pulse to be visible on M mode, the parietal and visceral pleura must be opposed. If there is air between the pleura then this would prevent transmission of the lung pulse from the lung to the probe (and you would see the stratosphere sign only). If there is fluid between the pleura it usually acts as a ‘shock absorber’ and so similarly prevents the lung pulse from being transmitted to the probe. However, it may often be seen in normal respiration with the seashore sign (particularly in health where tidal volumes are relatively low), and in combination with the stratosphere sign in states where the lung is expanded but not ventilating (for example one lung intubation, breath holding, severe pneumonia or inflammation, ARDS). It can therefore be understood that the presence of a lung pulse is one way of distinguishing pneumothorax from most other pathological states that generate a stratosphere sign (see table 1 below).
| Pathology | Seashore/ stratosphere | Lung pulse |
| Normal | Seashore | Present |
| Pneumothorax | Stratosphere | Absent |
| One lung intubation, breath holding, pleurodesis | Stratosphere | Present |
| Low tidal volume ventilation, ARDS, severe pneumonia/inflammation/fibrosis | Seashore/stratosphere | Present |
Table 1: difference in M mode appearances of various lung pathologies
Normal lung base
It is important to understand that in many instances, the image you see below the pleural line is all artefact, and is not the lung parenchyma that is being visualised. This helps in understanding why the appearance of both normal lung and pneumothorax is identical below the pleural line – because they both generate the same artefact on B mode imaging. In a patient with no pathology within the lung, the interface between solid abdominal organs and lung appears like a curtain coming in and out of the picture (see video 4).
A lines
In videos 1 and 3 and figure 1 there are distinct horizontal bright lines visible within the aerated lung below the pleural line. They are the same distance from the pleural line as the pleura is from the top of the screen, and are a reverberation artefact.
They are generated when an ultrasound wave hits the pleural line, gets reflected back to the probe and then instead of being absorbed by the probe it reflects back down towards the lung. As this wave hits the pleura and reflects back to the probe it will have travelled from probe to pleura twice and so the machine will ‘paint’ a line that appears within the lung itself, twice the distance of the probe to pleura. This process repeats and so multiple A line artefacts may be generated each equidistant from the previous. As some of the ultrasound wave is absorbed at each step the amplitude of the signal reduces sequentially and so the A-lines get less pronounced the deeper they are shown (video 5).
B lines
If there is increased amount of interstitial fluid (as in pulmonary oedema, contusion, infection or inflammation), or interstitial thickening (as in fibrosis), B lines will be seen. They arise from a marked difference in acoustic impedance between an object and its surroundings – in this case thought to be the aerated lung and the adjacent interlobular septae – creating a phenomenon of resonance (Figure 6).
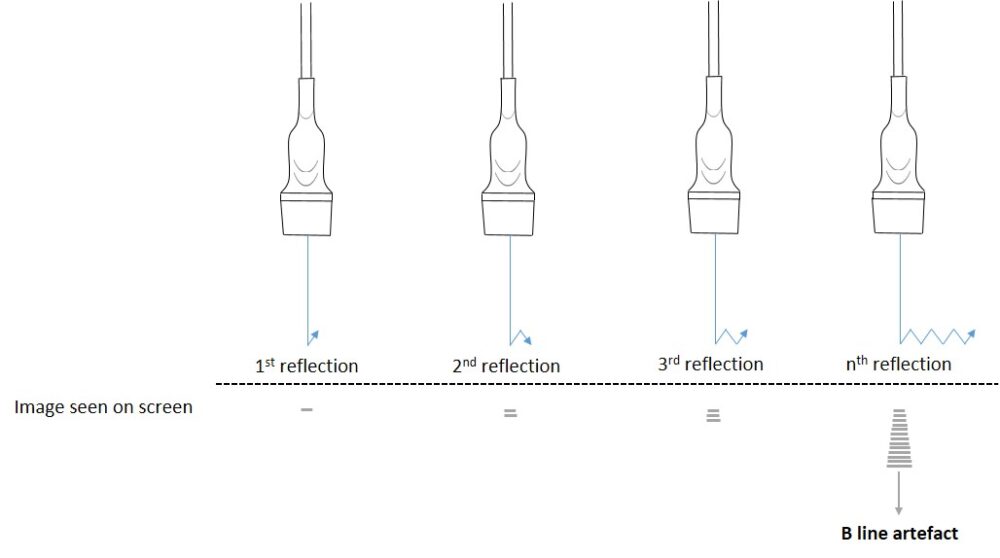
Figure 6: The generation of a B line. Although they appear as a single line on screen, they are in fact thought to be hundreds of horizontal reverberation artefacts which coalesce as a single laser-like projection
B-lines start at the pleural surface and travel at least to a depth of 18cm. They will move with respiration. They will appear as a single line, however with more interstitial fluid they can coalesce and finally the lung will look bright with individual B lines difficult to separate. A feature of B lines is that they will obliterate A lines. All these features can be seen in video 6 below.
Consolidation
Collapsed and consolidated lung can have the appearance of solid organs. In addition fully consolidated lung will show air bronchograms (look out for the white speckles within the consolidation). The periphery of consolidated lung will often have a coarse, irregular outline like the parenchyma has been ripped; this is the ‘shred sign’ of consolidation and is highlighted in the following video (video 7).
Pleural effusion
The vast majority of simple pleural effusions will be visible in the postero-lateral region of the supine patients (the PLAPS point of the BLUE protocol). Simple pleural fluid will usually be anechoic in appearance and, crucially, will allow the passage of ultrasound waves beyond the pleural line so you gn’).will start to see definition of the deep organs. In practice, this means you will often see the superficial diaphragm, the inferior border (right hand border on the screen) of the lung parenchyma and, if deep enough, the spinal column at the base of the picture (the ‘spine sign’).
Video 8 below shows examples of small basal effusions in both the left and right lung. Note how visible the diaphragm is due to the presence of the pleural fluid. Visibility of the superficial diaphragm is one of the features of a pleural effusion – to visualise the superficial diaphragm you must have pathology within (consolidation) or around (effusion) the lung base.
In addition, note the appearance of the segment of collapsed lung, thought to look like a jellyfish tentacle (the ‘jellyfish sign’).
In the following video there is a large pleural effusion causing lung collapse, and again the lung takes on a more solid-organ appearance.
There are more examples of pathology with explanations in the thoracic ultrasound pathology section.
For a detailed explanation of the BLUE protocol see here.
Have any questions?
If you have any FAMUS queries not covered by the following pages, please check out or FAQ section. If this still doesn't answer your queries, please contact FAMUS@acutemedicine.org.uk